
The aim of this app is to dynamically model the relationship between the spatial distribution of daylight in a room and its size, aperture configuration, shading devices and external obstructions. To make this process interesting and fun to play with, the calculations are optimised to be as fast and responsive as possible without compromising on accuracy. This means than you can interactively change the room size, its surface properties, apertures and shading devices, and the daylighting will update in close to real time even on a tablet or phone.
As this is only the second iteration of my daylighting tools, the model here is still limited to a simple axially-aligned rectangular room with any number of rectangular windows in each of the four walls, and cuboid shading devices and external obstructions. Working with such a simple model is critical at this stage as it allows me to investigate a range of optimisation strategies and more readily validate daylight results against other algorithms and applications, as well as serving as a test-bed for experiments with interactive model manipulation techniques without having to deal with the complexities of full CAD geometry. However, BIM and CAD models with arbitrary geometry are being worked on right now and will definitely be part of the next iteration.
Changing the Model
To change the size of the room, simply select any of its bounding surfaces and then drag the appropriate arrow in the direction you want. To adjust an aperture or external obstruction, again simply select it by clicking or tapping on any of its surfaces and then drag one of the manipulator arrows that should then appear. The circular manipulator in the centre of the object allows you to change its position. Whilst apertures are prevented from overlapping, you can still drag them into any area where they will fit, even within adjacent walls.
When an aperture or obstruction is selected, you can also double-click/tap on the central circular manipulator to restrict its movement to a particular axis. Either double-click/tap again to cycle between axis or deselect the object to reset.
You can click or tap on any numeric value displayed within a dimension line to display a simple editor that lets you directly enter numeric data. Clicking or tapping in the INFO panel on the left will also display an editor for numerically adjusting the main parameters of the currently selected object.
Daylight Calculation Method
Daylight calculations in this tool use the split-flux method to determine the internally reflected component and raytracing to determine the direct sky and externally reflected components. Rays are used to calculate exactly which parts of the sky are visible from each grid point and which are occluded by external shading and obstructions.
Daylight illuminances are then calculated using detailed sky luminance distributions generated using the CIE Standard General Sky method described in both ISO 15469:2004(E) and CIE S 011/E:2003. You can select any of the 16 standard sky types or load in a weather data file and have the sky distribution generated dynamically using hourly direct and diffuse solar radiation or illuminances.
The calculation method has undergone extensive validation using direct comparison with the results of both Radiance and DIVA/DAYSIM, and the correlations are very close for this type of simple room configuration. More detailed information on the validation process is given in the Validation section below, however feel free to test it yourself as the tool can export any of your models directly to Radiance and/or DIVA/DAYSIM, and you can then import the results back in for visual comparison.
Interesting Features
In this version, all the daylight calculations are still being done in JavaScript, which remains surprisingly and blazingly fast even with raytracing. I do have a GPU-based version I have been playing with which is even faster. However, given that there is so much else going on when you interact with the model (especially when contours are displayed and multiple windows are being checked for overlaps), it turns out that the daylighting calculations are only a relatively small load compared to all of the shape tessellation, mesh regeneration and DOM updates required. Thus the speed increase due to using the GPU with this simplified model is not actually that noticeable. When I move to analysing more complex non-rectilinear models, the GPU version will come into its own and make an extraordinary difference.
Shading Devices and External obstructions
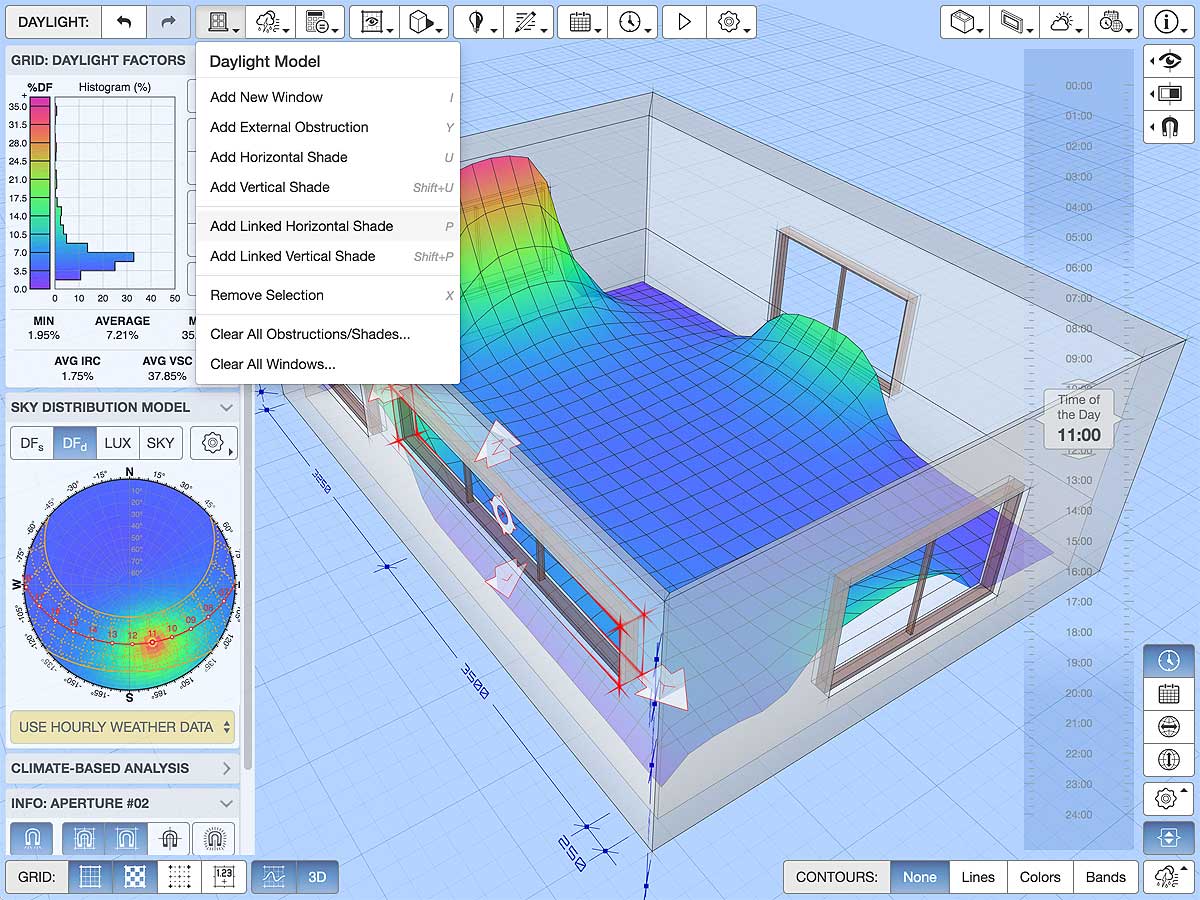
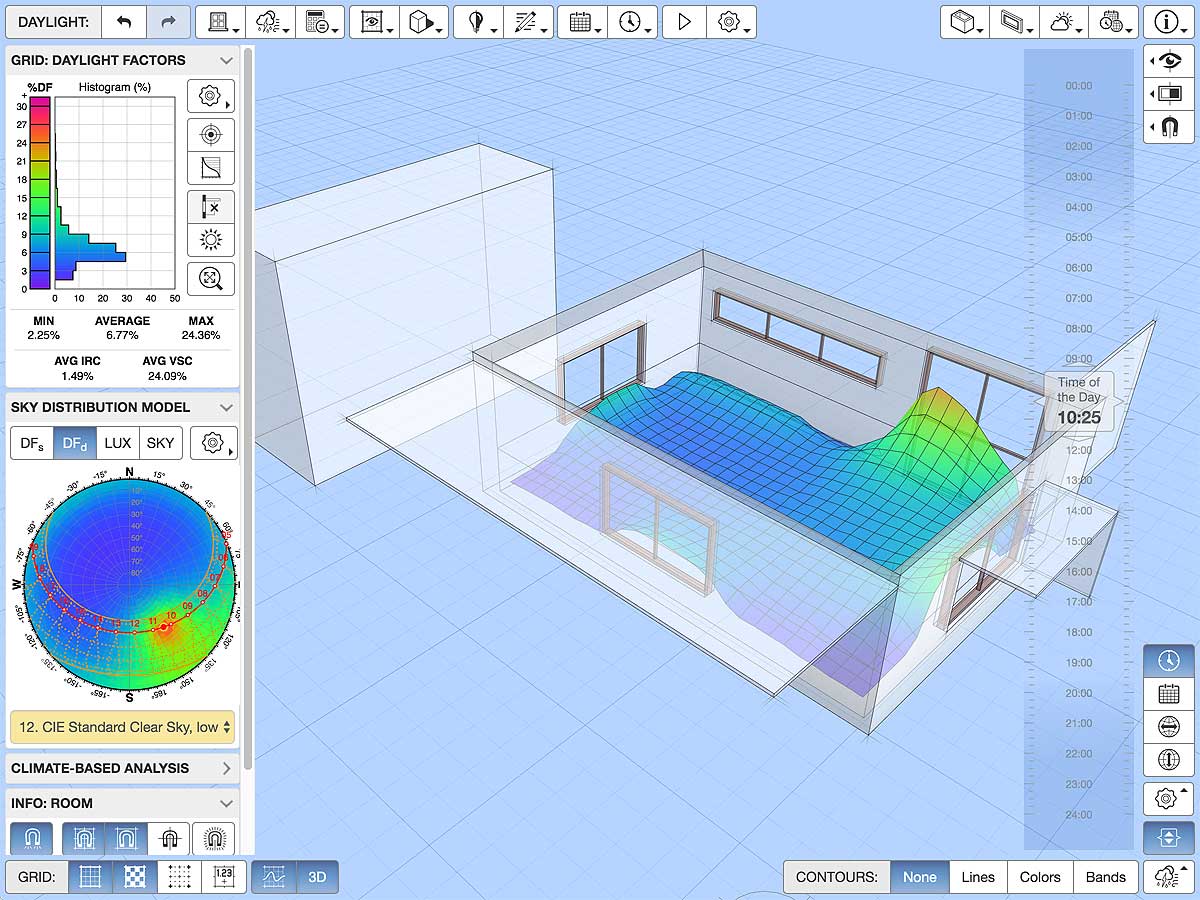
The most important new feature of this version is the ability to add and edit external shading devices and site obstructions. Their occlusion and reflection effects are determined using raytracing, which you can visualise by displaying an interactive shading mask within the model. Significantly, you can also toggle the effects of external shading and obstructions on and off using a single button in order to visualise their relative effects and gain a better understanding of how they are working as you design them.


Climate-Based Daylight Modelling (CBDM)
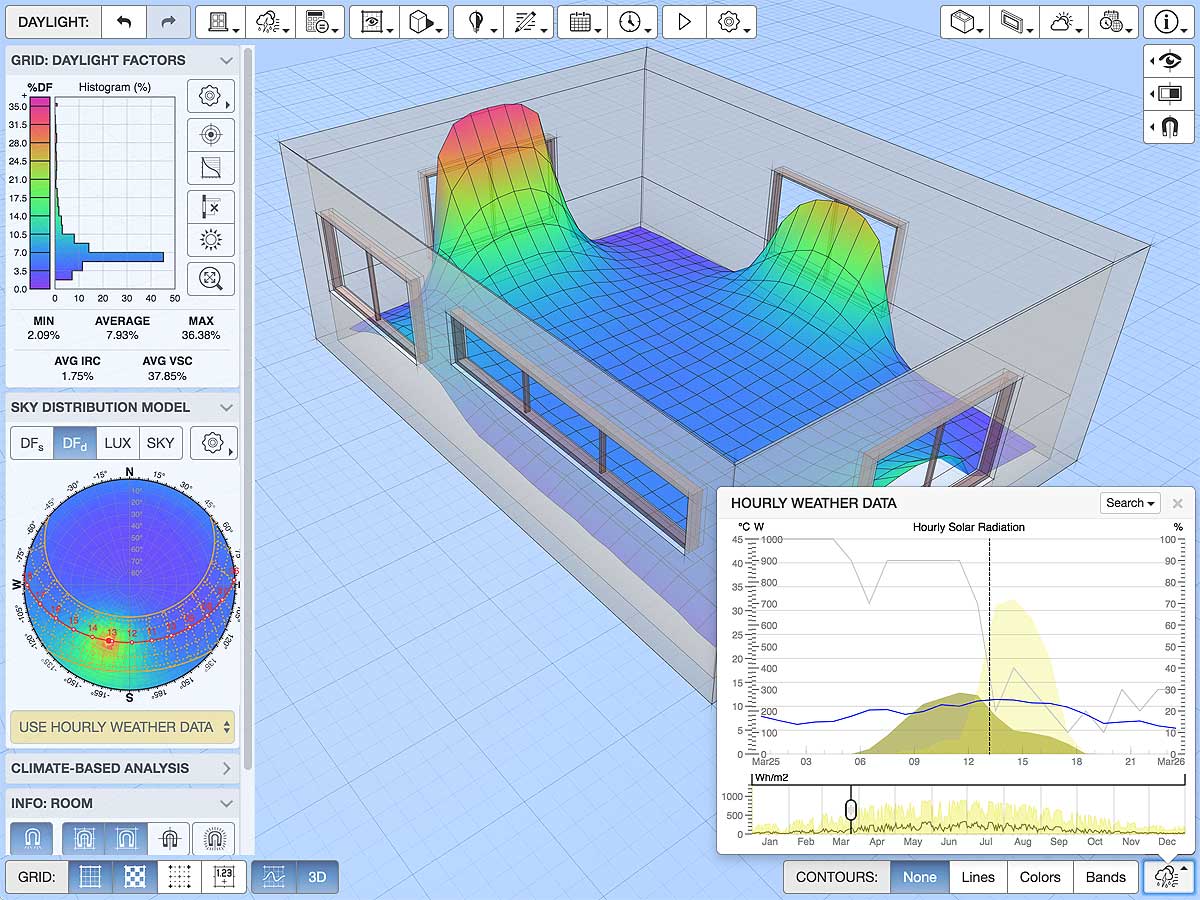
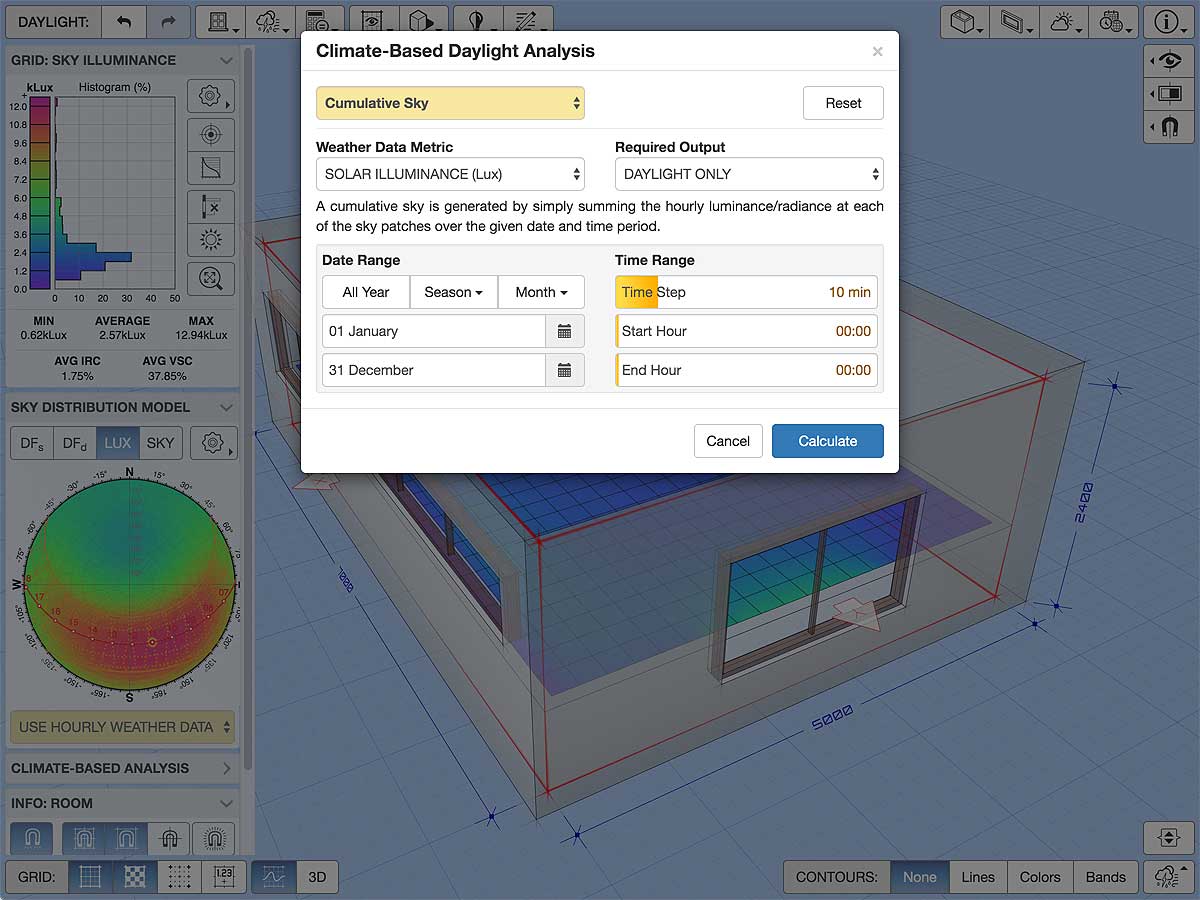
Another new features of this version is the use of detailed and dynamic sky distributions. You can load in any weather file from EnergyPlus (.epw) or DIVA/DAYSIM (.wea) and it will use the Perez All Weather Sky model to generate dynamic sky distributions based on instantaneous direct and diffuse radiation and/or illuminance. From this, the hourly illuminance at each grid point across the entire year can be calculated, and then analysed to derive spatial dynamic daylight metrics. When viewing a dynamic sky, you can also use the date/time controls to interactively move through the day and year, or watch a simple animation.

Sky Luminance Distributions
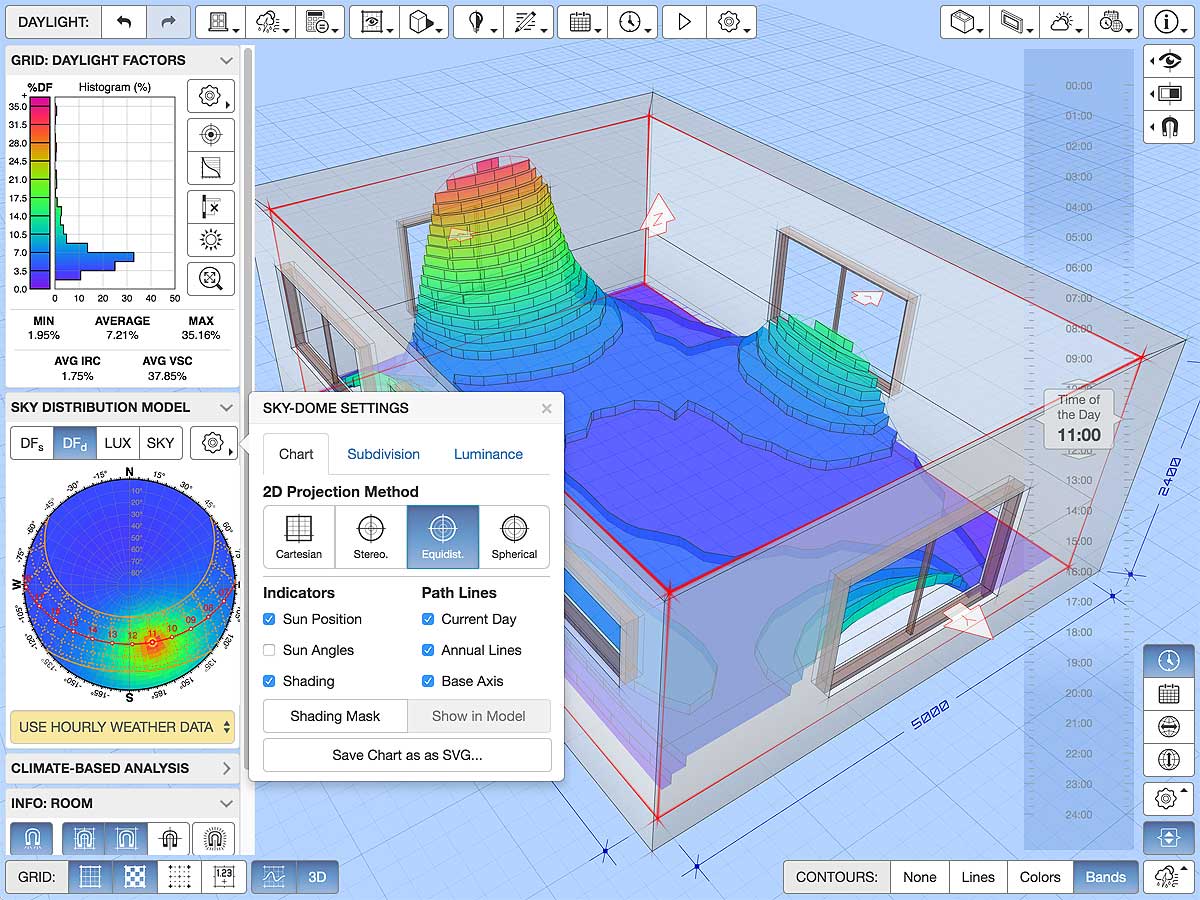
The app also displays the current Sun-path and sky luminance distribution alongside the model in the SKY DISTRIBUTION MODEL panel. This panel allows you to toggle between traditional daylight factors based on a static sky and dynamic daylight factors and illuminances based on more complex sky distribution models. The visible sky percentage differs from daylight factor in that it does not consider incidence on a horizontal surface or the current sky distribution, but only the fractional number of sky patches visible from each grid point.
Clicking the settings button or anywhere within the Sun-path diagram shows the SKY-DOME SETTINGS popover which allows you to select from a range of projections as will as setting the number and distribution of sky patches and the current luminance scale and sky type.


Numerically Editable Dimensions
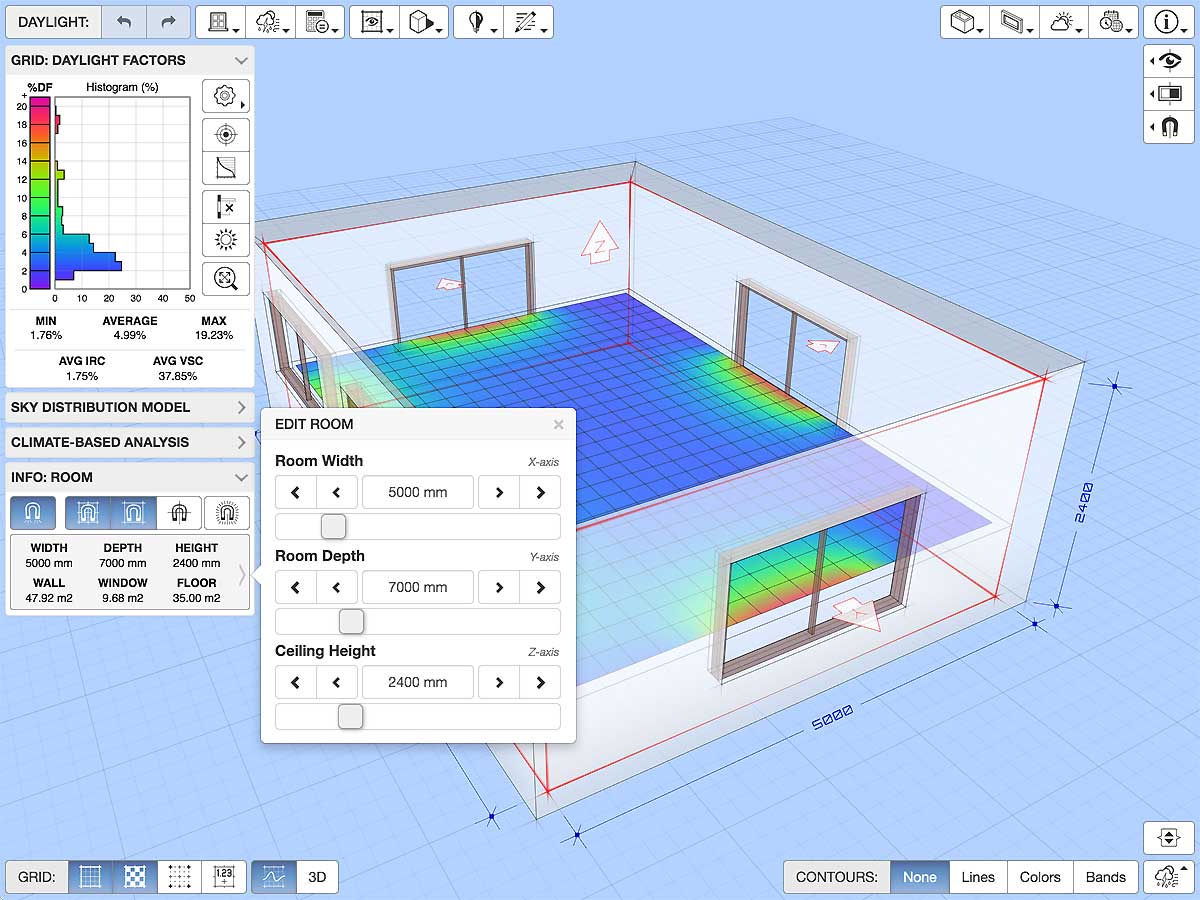
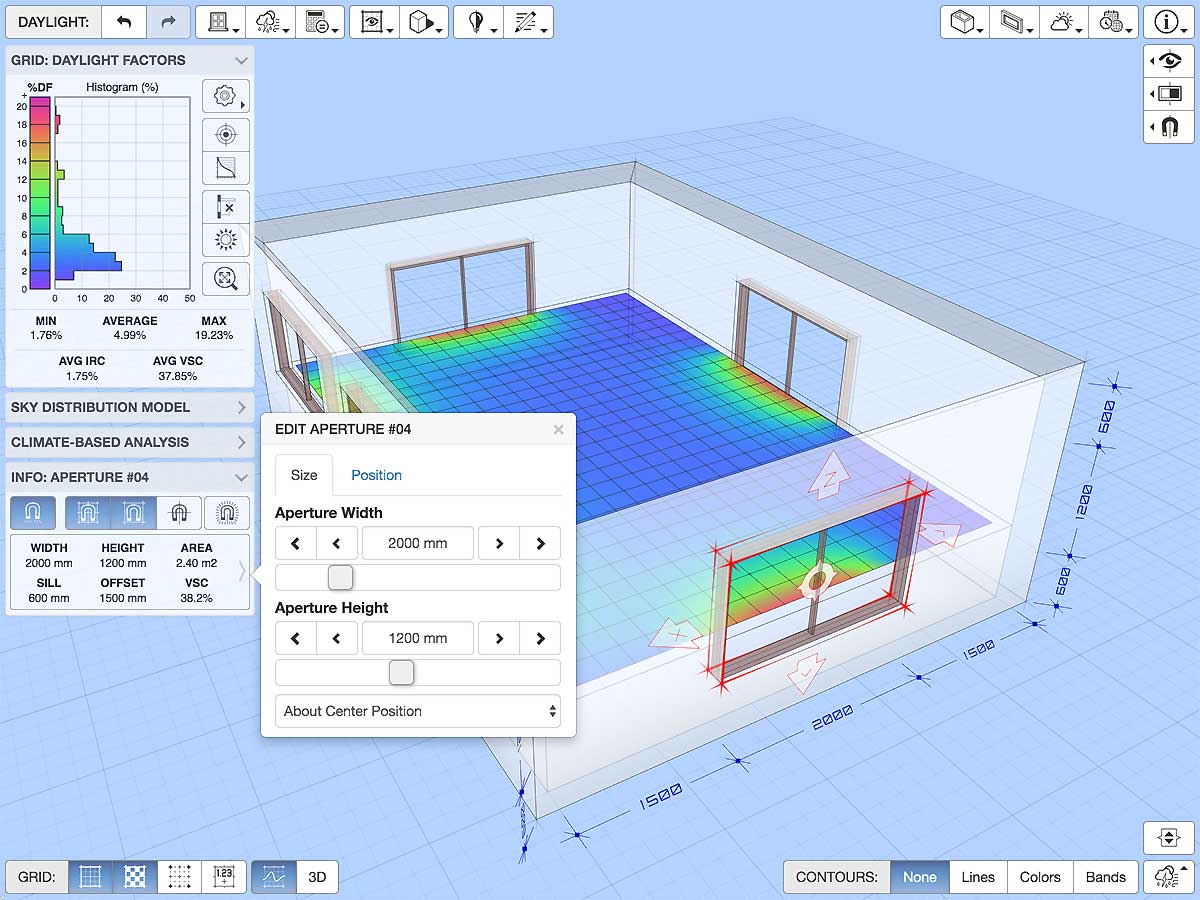
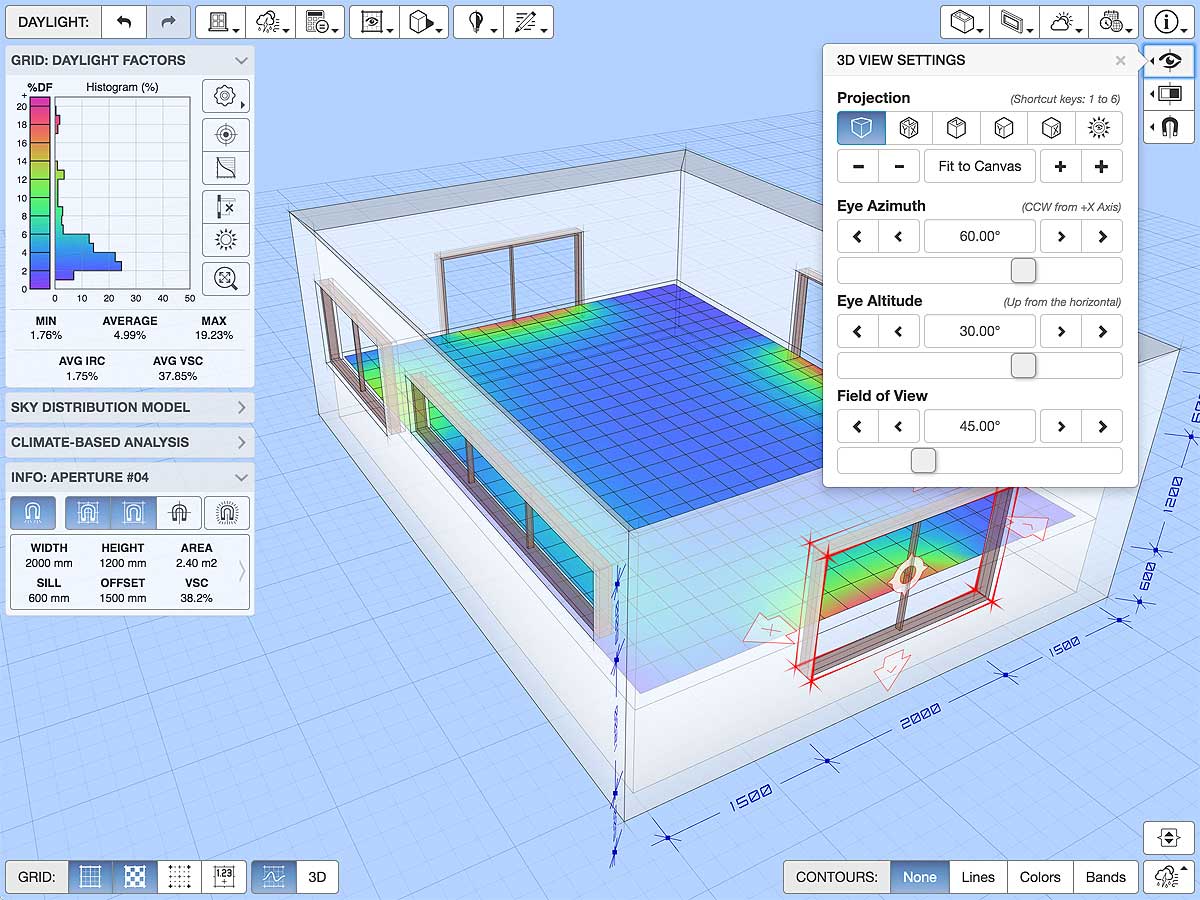
Another feature of this app is the ability to numerically edit dimensions within the context of the 3D model. When you select the room itself, or a window aperture, external obstruction or the work-plane, you will see both a set of manipulator arrows and some dimension lines displayed within the model. The dimensions will update as you interactively drag the manipulator arrows around, but you can also click on any dimension value to display a small popup editor that allows you to numerically edit it, as shown in Figure 4a. The editor includes buttons and a slider to make touch-based adjustment and incrementing a bit easier. You can also use the INFO panel to both see the detailed dimensions of the current selection and edit them as a group.


Spatial Analysis
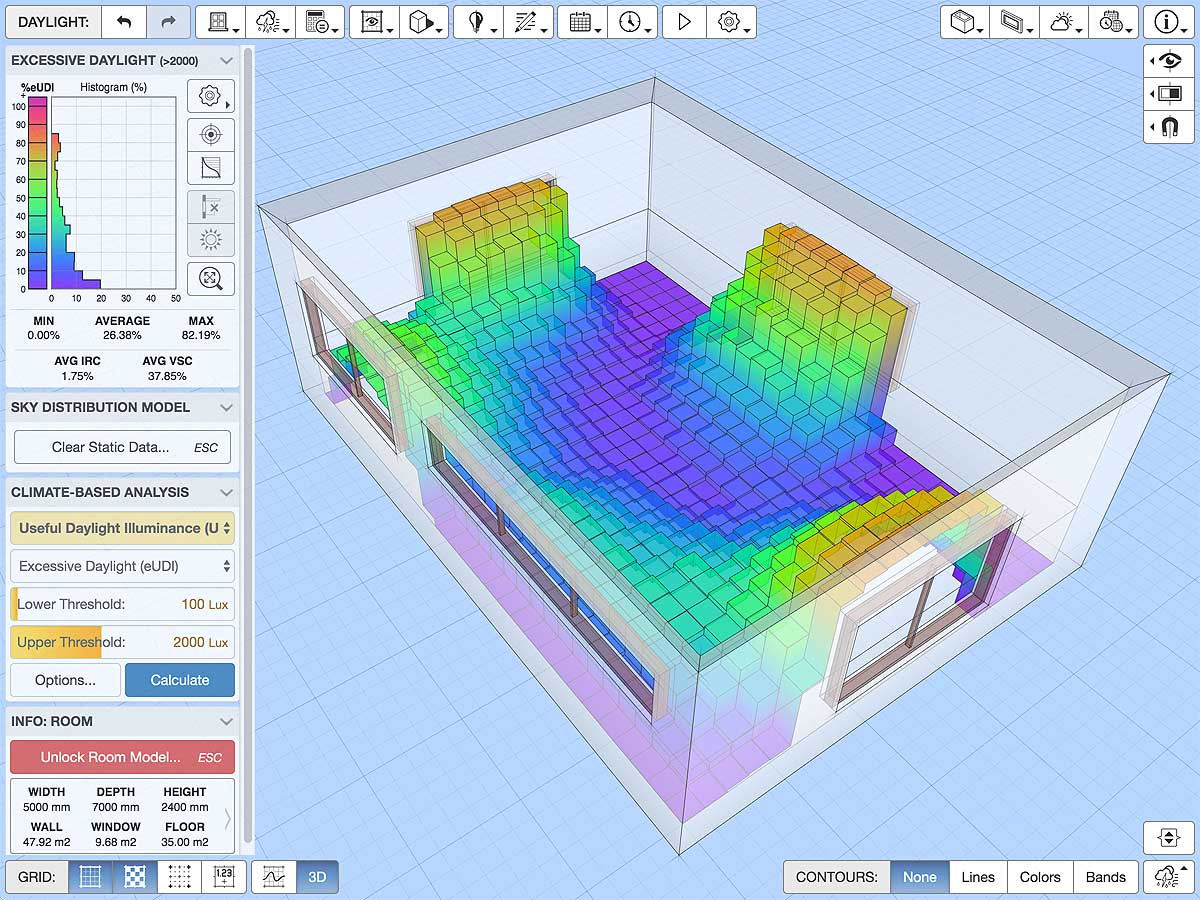
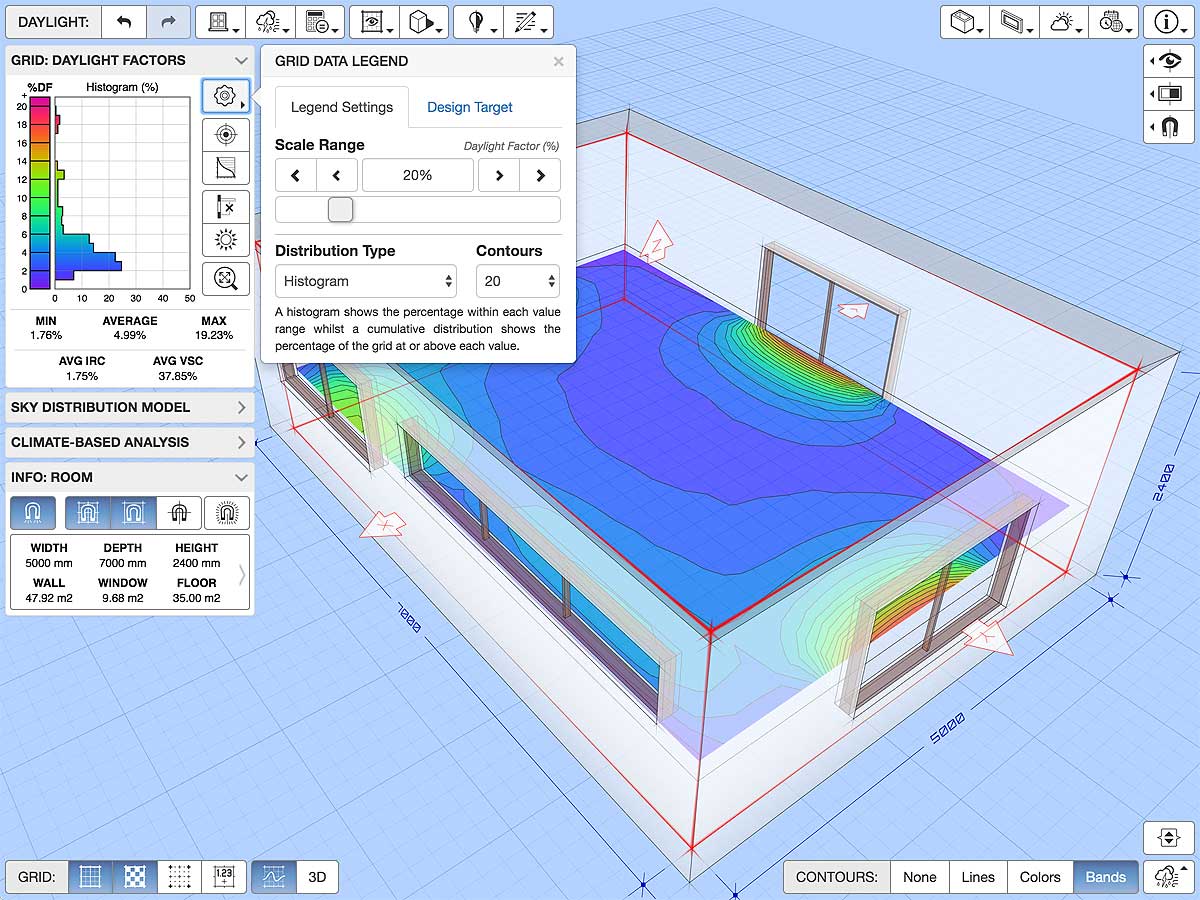
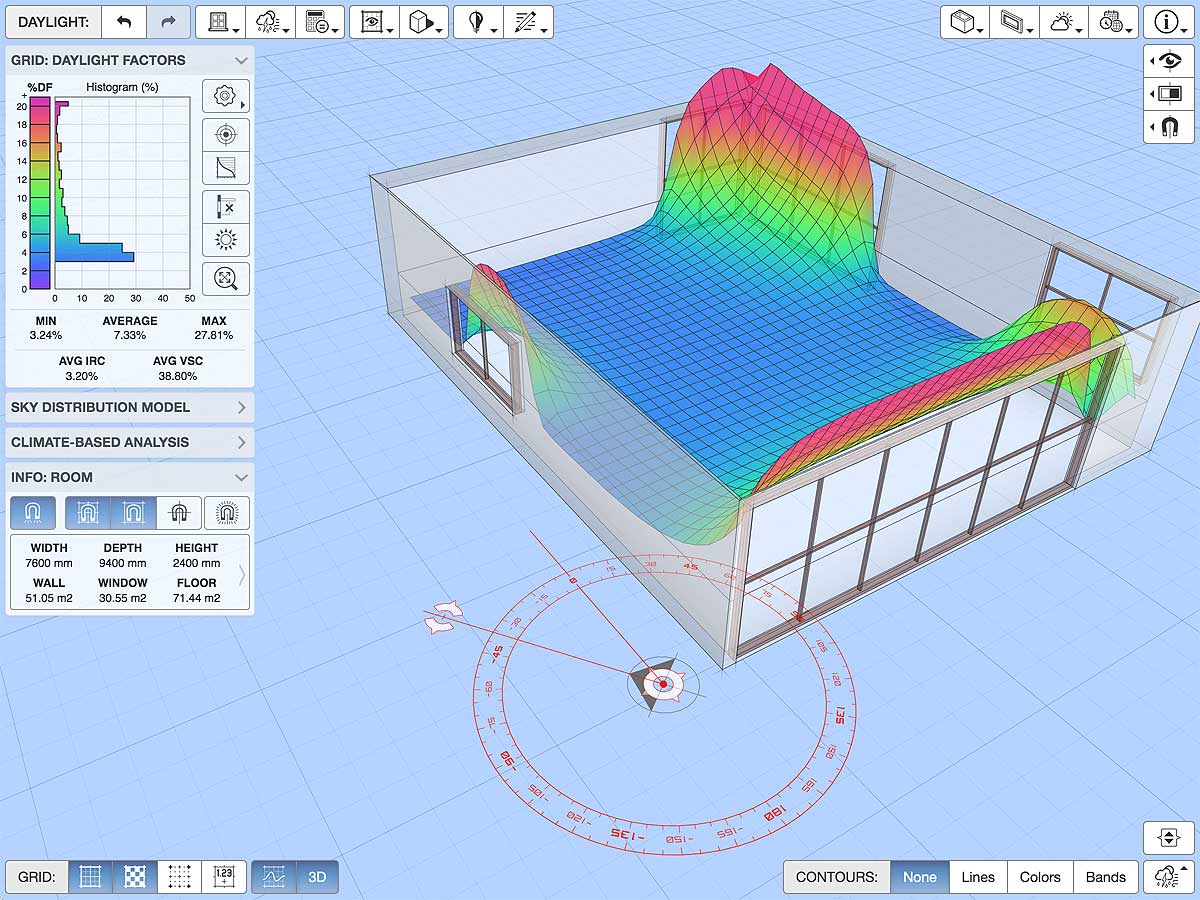
The spatial distribution of daylight within the room is shown as a horizontal data grid, primarily because most daylight performance metrics are based on the illuminance incident on a horizontal work surface. This data can be displayed as a colour map, a binned grid, contour lines, contour bands or even textual point values. In addition, a histogram of values within the grid is also displayed in the GRID panel on the left, together with the current legend scale.
Whilst the distribution of daylight across the room is very informative, the design goal is very often to achieve a specific daylight factor or level over a given minimum area of the work surface. The Design Target tab allows you to specify the required daylight factor threshold value and display the actual area of the analysis grid that is at or above that value. In addition, the actual numeric percentage is displayed as a value within the GRID overlay panel. As a shortcut, you can click and drag this numeric percentage up ad down within the legend to interactively set the target daylight level.

Model Dimensions and Properties
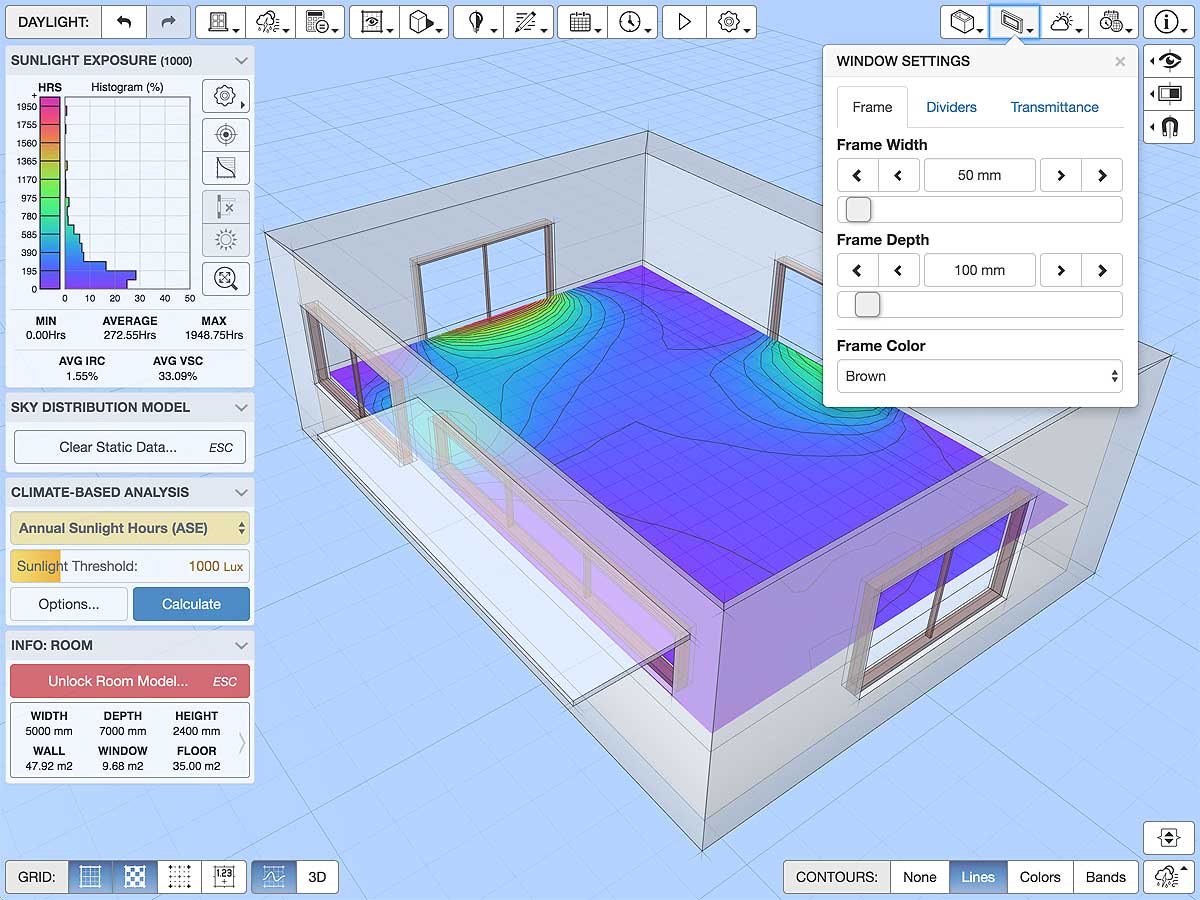
Use the MODEL SETTINGS panel to adjust the overall size of the room as well as construction and surface material properties. Use the WINDOW SETTINGS panel to adjust the size of window frames and glazing bars as well as the maximum span for glass panes before additional dividers are inserted.


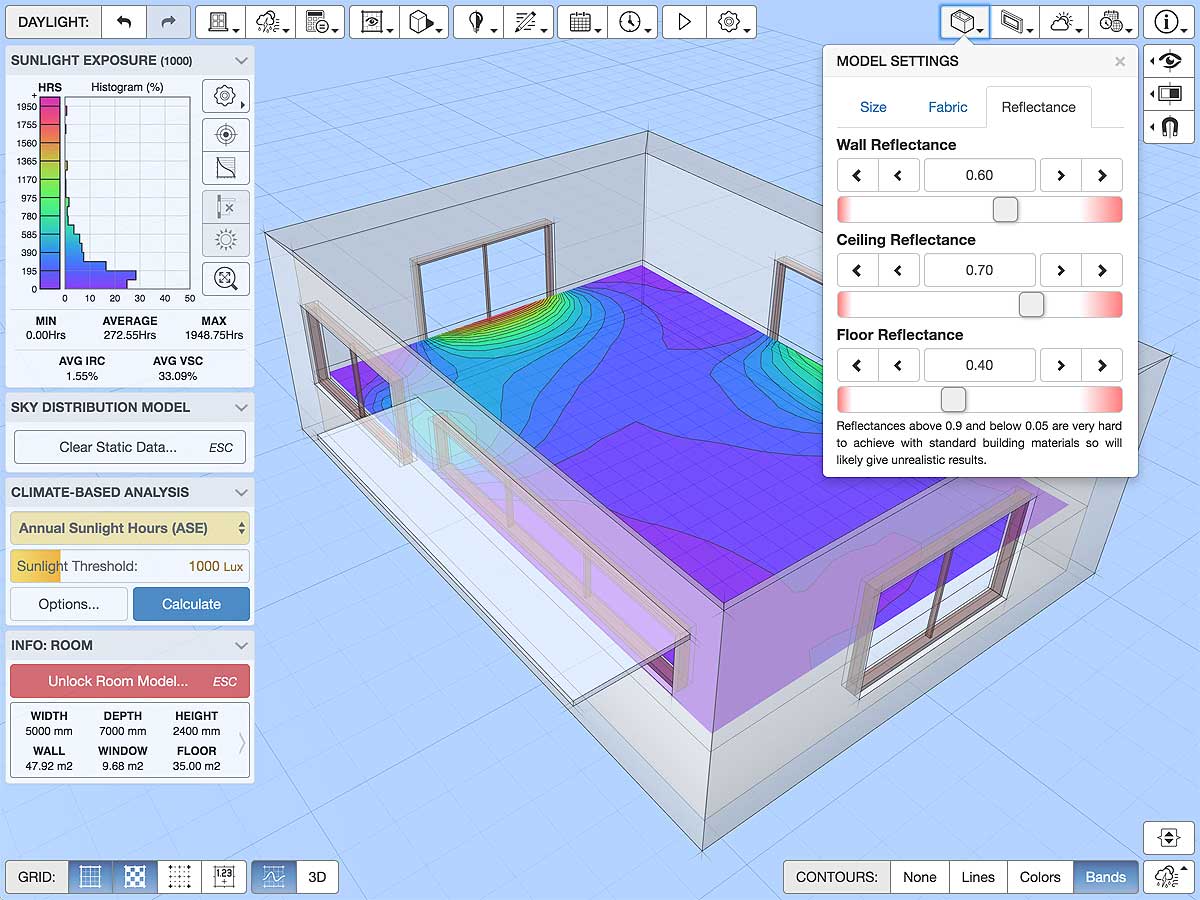
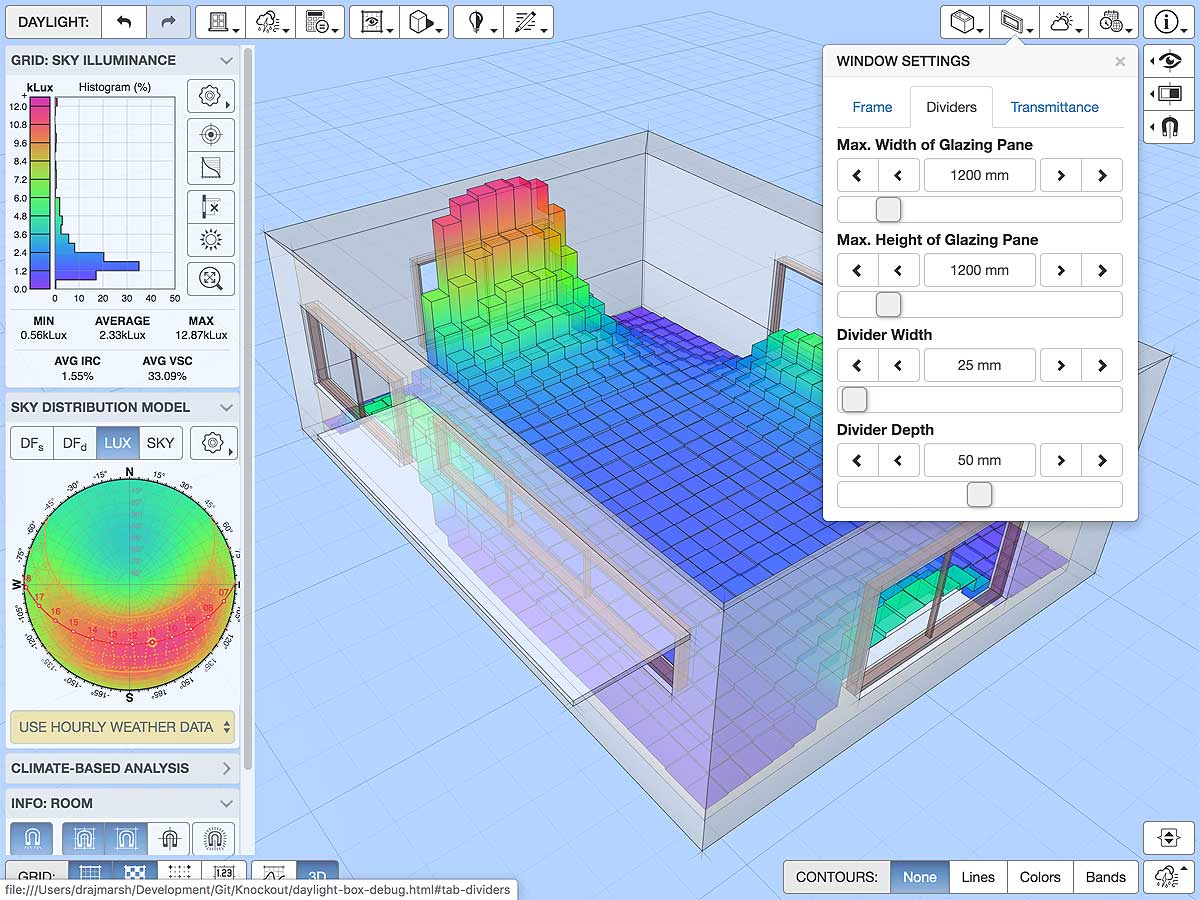
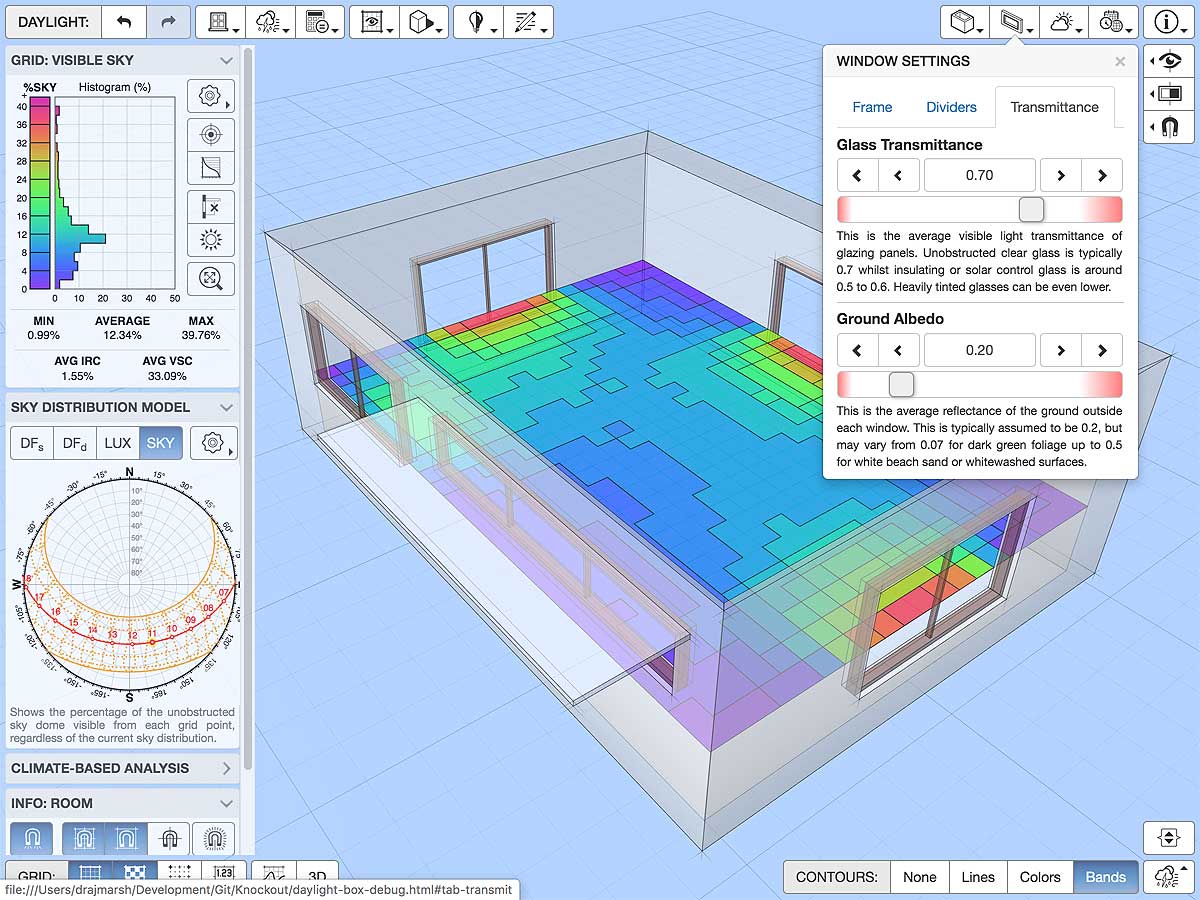
The areas of red shown in reflectance and transmittance sliders indicate unrealistic values not easily achievable with standard building materials. The surface reflectances and glazing transmittance values set here are intended as room-average values rather than surface-specific. This is so that the effects of changes in each value can be seen more clearly within the model without having to edit multiple materials, etc. The next iteration will handle more complex rooms with multiple materials and insets.
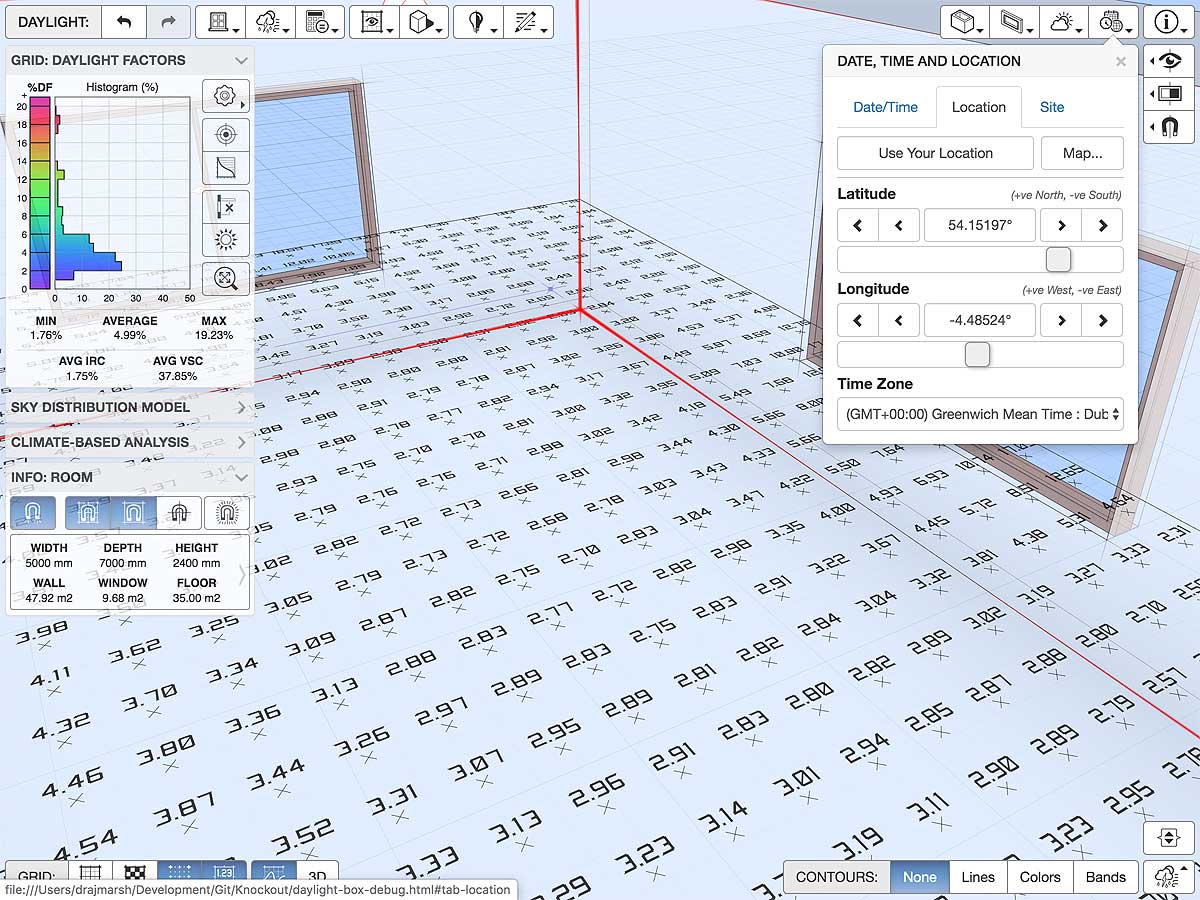
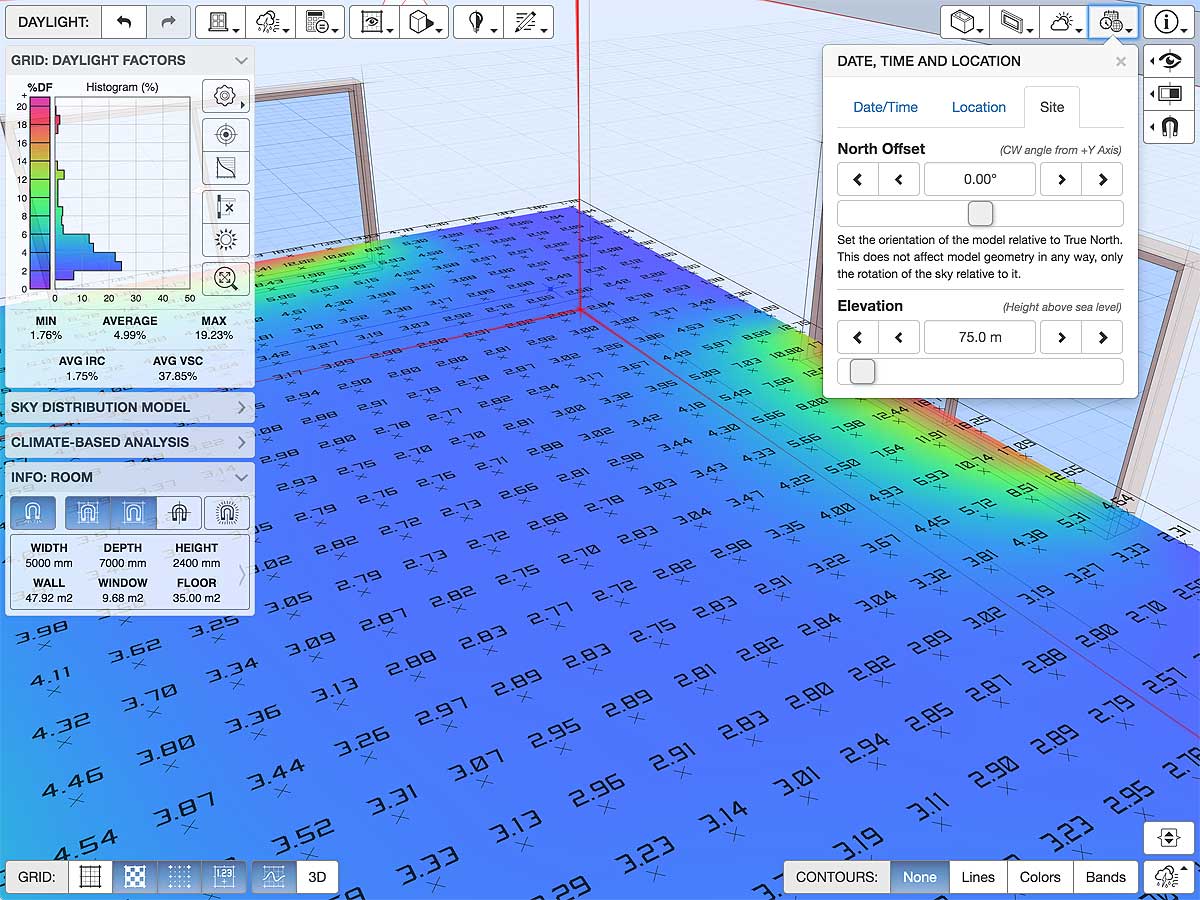
Date, Time and Location
Dynamic clear skies with a visible solar corona are sensitive to the date, time and location as these determine the position of the Sun in the sky. Even though only showing daylight rather than sunlight, there are still concentrations of luminance in the sky around the Sun and extending towards the horizon immediately below it. Thus, in this version you can set these values directly. You can also set these using the slider located on the right hand side and, if you have weather data loaded, the weather data chart located at the bottom-right.

3D Views and Interaction
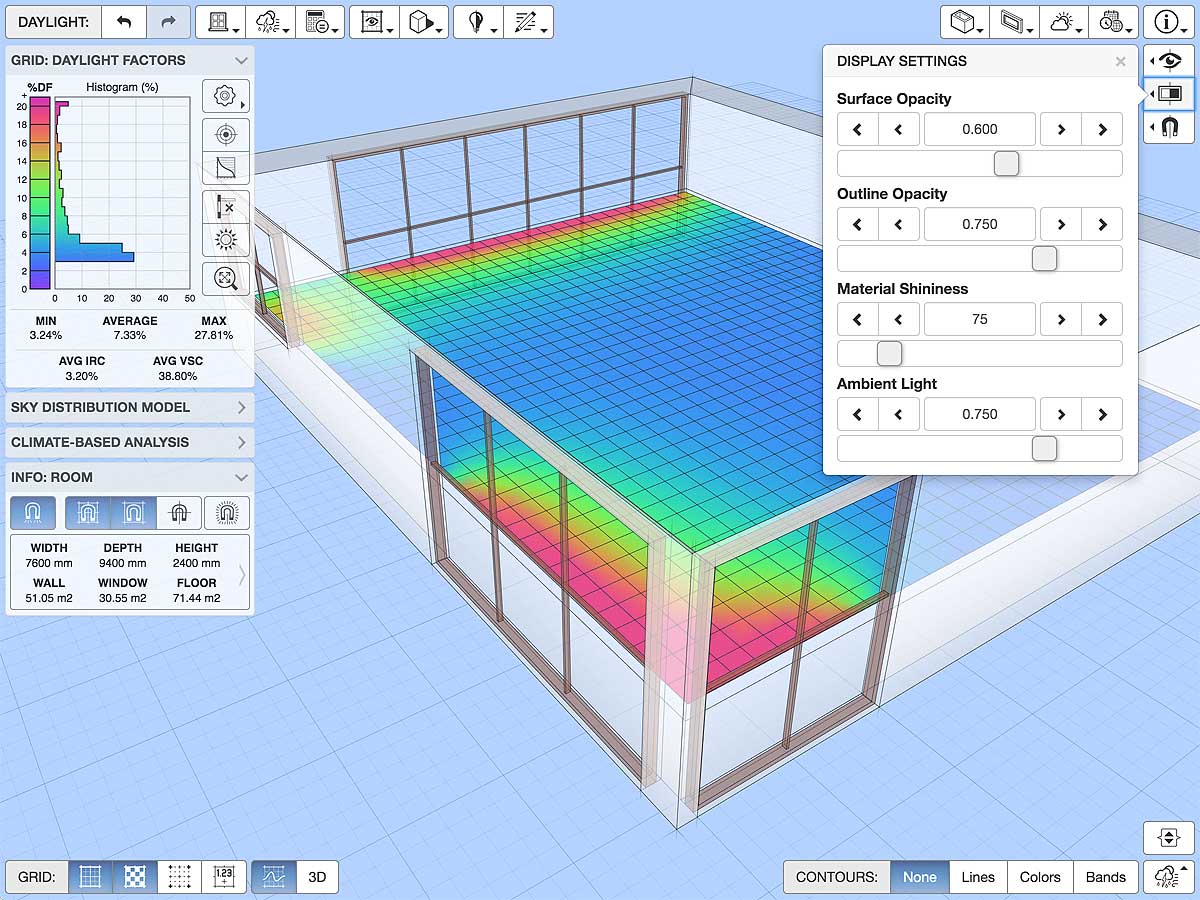
You can also fully control the 3D model view as well as detailed display and snap settings.


Validation
This daylight calculation method used in this tool has undergone extensive validation using direct comparison with the results of Radiance and DIVA/DAYSIM using the exact same room models, and the correlations are very close for most common room configurations. For anyone interested, a detailed report on the methodologies and results of this testing is available.
To test this yourself, you can export the room model to both Radiance and DIVA/DAYSIM and it will create all the necessary files together with a bash script and DOS batch file to run it on any system with either of those applications installed. You can then drag and drop the output files from those calculations back in to the app window in order to directly compare results. For anyone without Radiance, I have provided an experimental service to run it remotely on one of my mac-mini servers and download the results automatically.
Obviously I haven’t implemented the whole of Radiance inside a web browser, so the results of this tool will always differ slightly from Radiance. However, direct comparison shows that, for such a simple room configuration, results are actually pretty close and that the response to individual parameters is sufficiently similar to make it a useful and compelling educational tool.
The main difference between the calculations in this tool and those in Radiance is how indirect reflections are handled. Both use ray-tracing to determine which parts of the sky are visible from each point and which are obstructed. However, this tool uses the split-flux method to calculate the average internally reflected component across the room whilst Radiance builds its own ambient file and samples that to determine the ambient diffuse component at each point.
Another potential difference is how diffuse reflections from external obstructions and shading devices are used to determine the externally reflected component. For speed, this tool does not resample the sky dome to accurately calculate the sky illuminances incident at each intersected point on the faces of external shading devices and obstructions. Instead it uses a simplified model of the reflected diffuse sky and moderates the reflected value by the face’s tilt angle and surface reflectance value.
Future Development
The next steps for this app are to include skylights and roof-lights in the model, as well as arbitrary room geometries and internal obstructions. I also want to add another panel for taking ‘snapshots’ of the daylight under different conditions so that you can easily toggle between them for direct visual comparison.
Before that though I have some work ahead to make the Undo/Redo rock solid as this has fallen a bit behind some of the new features I have added. I should also integrate the Schedule Editor so that the dynamic daylight metrics can use more complex occupancy profiles and schedules. Another feature would be to merge intersecting obstruction geometries using CSG, but I should probably focus that time more on supporting arbitrary CAD ad BIM geometry.
Change Log
2.0.0 2019-10-15
Switched to using ray-tracing for all aspects of the daylight calculations in order to more accurately deal with complex shading, external obstructions, arbitrary sky distributions, actual illuminances and visible sky analysis.
Added ability to select any of the 16 CIE Standard General Sky distributions and see how spatial daylight changes dynamically with date, time and location.
Added ability to load annual hourly weather data and use of the Perez All Weather Sky model to generate dynamic sky distributions based on instantaneous direct and diffuse radiation and/or illuminances.
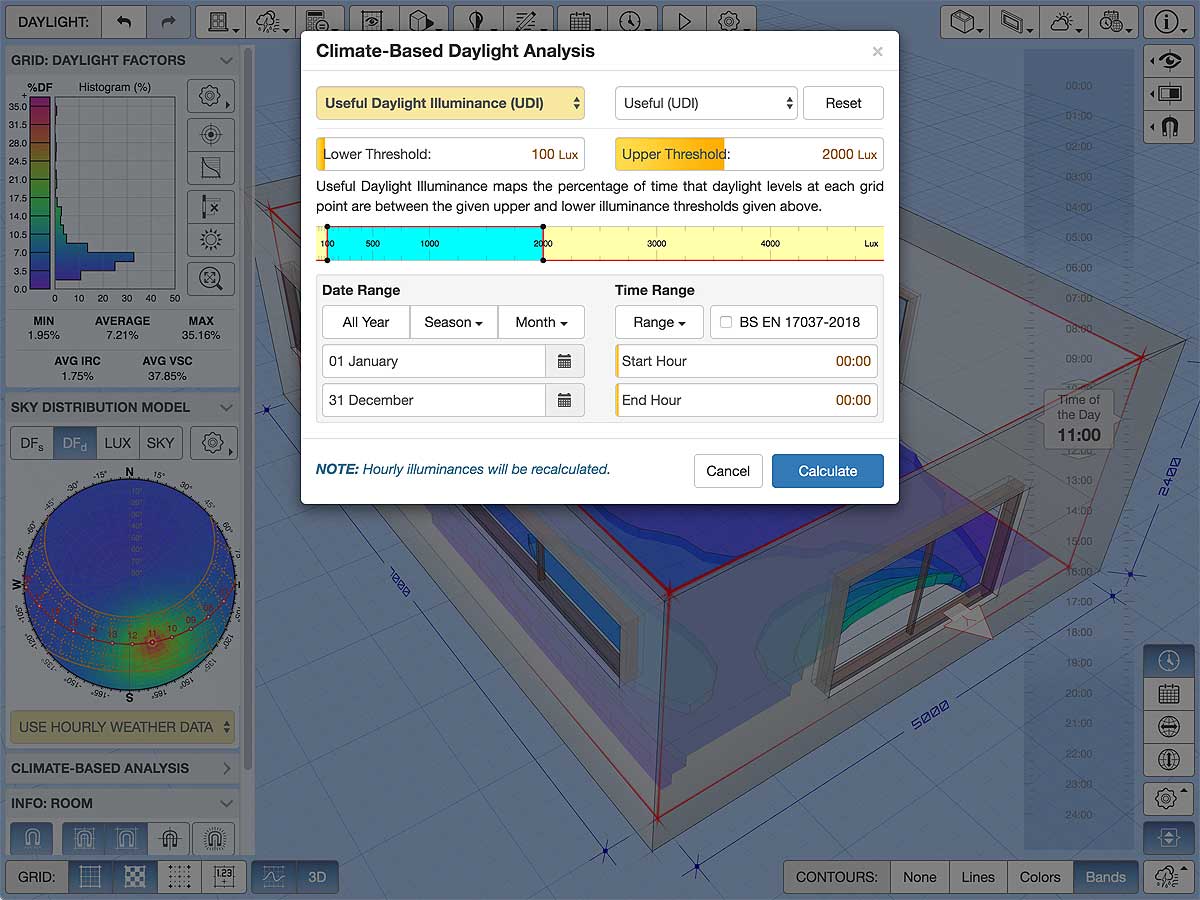
Now supports climate-based daylight analysis with the calculation of metrics such as Daylight Autonomy (DA), Useful Daylight Illuminance (UDI), Daylight Saturation Percentage (DSP) and Annual Sunlight Exposure (ASE), as well as others such as cumulative skies and the No-Sky-Line (NSL).
1.0.0 2018-02-03
Added ability to toggle the display of grid lines, surface colours, sample points and textual values within the daylight distribution grid. These options are available as a new menu item in the top-left of the application area as well as toggle buttons in the bottom-left.
Having had to explain way too often why the daylight grid does not appear to cover the entire internal area of the room, I have added an option to toggle between a smoothly interpolated grid between sample points and a block grid where cells are centred on each sample point and flatly coloured based on the sample value. Toggling this option should clearly illustrate the difference between the two approaches, but a more detailed discussion can be found in the article Fitting an Analysis Grid.
Changed the algorithm for determining the wall into which new windows are inserted to one based first on those actually facing the camera and then the currently selected window, if any. It is pretty straightforward to drag windows across any two camera-facing walls so this change should not prove too disruptive, but is considered more intuitive for new users.
Added an additional window edit popover. Now, when you select a window in the model, the information panel beneath the legend chart on the left of the application area should switch from
INFO: ROOMtoINFO: APERTURE #XX, where XX is the numerical index of the aperture in the model. Clicking on the information panel, or pressing theXkey, will display a popover allowing you to edit the position and size of the window relative to the host wall.Added a
SNAP SETTINGSpopover to the list in the top-right of the application area. This popover allows you to select different snap options as well as the grid snap size and dimension settings.Double-clicking on the central manipulator of an already selected window will toggle between a horizontal-only or vertical-only movement indicator. This will reset to both axis whenever you change selection, or you can simple double-click again to cycle through the options.
0.0.6 2017-03-19
Added alignment snapping when interactively dragging the position or size of an aperture. By default, it only snaps to other apertures in the same wall. However, you can choose ‘All Apertures’ in the Cursor Snap menu to check alignment with all apertures in any wall. You can temporarily toggle this by holding down the SHIFT key as you drag, or actually toggle it using the
Vkey.Decoupled the design target daylight factor from the histogram bin size. Previously the percentage above target was calculated from the histogram so the daylight factor value was limited to the same increments as the binned data. Now the percentage above target is calculated independently and directly from the daylight grid, so the target can be set to any value.
0.0.5 2017-02-16
- Latest Chrome release (57) just dropped support for line widths other than 1 pixel on all platforms, irrespective of hardware capabilities. As this made my line-based 3D font pretty hard to read at a single pixel width on Retina and other high resolution displays, I had to spend a week creating a variable-weight triangulated font instead. Not as simple as it sounds but at least its scalable and readable now.
0.0.4 2016-12-08
- Fixed a problem with new Chrome release (55) which introduced support for PointerEvents but with a bug where the mouse button value was not accurately reported for all move events.
0.0.3 2016-11-28
Added perspective, axonometric, plan, front and side view button in View Settings.
Added ability to click on a dimension value and interactively edit it in a pop-up panel.
Added a ‘ROOM SIZE’ editor panel which you can display by clicking the ‘ROOM INFORMATION’ overlay. This allows you to numerically edit each room dimension.
Fixed issues when undoing the interactive movement of a window to another wall.
Added a fix and notification for Safari slowing down significantly when using a WebGL canvas larger that 1440x900 within a scaled display on a Retina screen.
Improved automatic ground grid sizing and snapping when significantly changing the room size.
0.0.2 2016-10-06
Added JSON editor to allow loading and saving of application settings.
Added ability to read model and display settings from URL parameters.
Added ability to create a URL containing model and display settings.
0.0.1 2016-09-28
- Initial release.
Click here to comment on this page.